


Global air cargo tonnages rebounded strongly in the first full week of 2026 in a manner similar to last year, but with chargeable weight around +5% above the equivalent levels a year ago, according to the latest weekly figures and analysis from WorldACD Market Data.
Preliminary figures for week 2 (5 to 11 January) point towards a resumption of some of the broad trends experienced in 2025, in which cargo tonnages rose by an average of +4% across the full year, with rates averaging slightly below their level the previous year. It’s worth noting, however, that 2025 began relatively slowly, with year-on-year growth averaging +2% last January and February, and therefore early signs of year-on-year (YoY) growth in 2026 should be seen in that context.
Week-on-week rebound
Worldwide air cargo tonnages in week 2 recorded a +26% week-on-week (WoW) rebound, following consecutive steep weekly drops of -22% and -19% at the end of last year, leaving worldwide tonnages still -20% below their mid-December levels, based on the more than 500,000 weekly transactions covered by WorldACD’s data. The strong rebound in week 2 can be seen across all origin regions except for Africa.
Capacity partially returned after freighter services were cut back sharply at the end of last year from their peak levels in the final quarter, as is normal for the season. Freighter capacity regained more than +15% in week 2, WoW, although overall air cargo capacity remains around -7% down compared with mid-December.
Average worldwide rates slipped downwards by a further -2%, WoW, to US$2.46 per kilo. That’s around -10% below their average level in mid-December, but it’s slightly above (+1%) the $2.43 full-market average rate this time last year.
Year-on-year tonnage growth continues
The YoY worldwide tonnage growth of +5% in week 2 was led, in percentage terms, by increases in traffic from Middle East & South Asia (MESA, +16%), Asia Pacific (+8%), and North America (+7%) origins, although in absolute terms the biggest factor was a further YoY increase in cargo from Asia Pacific origins. That +8% YoY growth in cargo from Asia Pacific origins was in line with the average YoY increase in traffic from Asia Pacific origins of +8% for the full year in 2025.
Examining individual major markets from Asia Pacific also reveals a continuation of some of last year’s patterns, with tonnages in week 2 from Asia Pacific to the US up by +10%, YoY, mainly driven by strong traffic growth from Southeast Asia origins, while chargeable weight from China and Hong Kong to the US was flat, YoY.
Meanwhile, from Asia Pacific origins to Europe, tonnages in week 2 were up +15%, YoY, mainly driven by growth from China, Hong Kong, Taiwan and Thailand. But that very high YoY growth rate partly reflects a slow start last year in volumes from Asia Pacific to Europe: volumes from China and Hong Kong to Europe last January were up by a relatively modest +3%, but tonnages from Southeast Asia to Europe were down -17%, YoY, resulting in a slight decrease in overall Asia Pacific to Europe volumes in the first few weeks of 2025.
Dynamic MESA market
Total tonnages from MESA origins last year were roughly the same as in 2024, taken as a whole, although MESA origin markets saw significant YoY growth in the final two months of 2025, of +13% and +11%, respectively, in November and December. The +16% YoY growth from MESA origins in week 2 is, therefore, broadly consistent with those patterns, boosted by a particularly strong YoY rise from Dubai. MESA to US tonnages were up +10%, driven by traffic growth from Dubai, India and Bangladesh, and MESA to Europe volumes were up by +16%, also driven by traffic growth from Dubai, India and Bangladesh.
Some container shipping services have been returning in recent weeks to the Red Sea route via the Suez Canal, with Maersk this week the latest to announce a limited resumption of services, although volumes remain less than half their level prior to the onset of attacks by Houthis on shipping more than two years ago. Returning capacity to that market is likely to be a factor for air cargo, which has seen higher volumes from that region in the last two years, although the latest tensions between the US and Iran highlight continuing instability in that region that is likely to limit or slow down a full return to pre-2023 supply chain patterns.
Spot rate declines
Average global spot rates in week 2 slipped slightly further downwards (-1%, WoW), to US$2.62 per kilo, despite +6% WoW rises from North America and Africa origins, with spot rates ex-Asia Pacific losing -5%, WoW. Compared with this time last year, global spot rates in week 2 were down -4%, YoY, largely due to declines from MESA (-21%), Asia Pacific (-6%) and Europe (-4%) origins, partially offset by a +12% rise from Africa origins.
Source: WorldACD
Global business aircraft flight activity was up 4.2% year over year (YOY) in the first half and 3.5% in North America alone, where operations reached their strongest level...

The first half of the year has brought difficult news about the worsening effects of climate change: a rollercoaster of extreme heat, wildfires, flooding and sea-ice lows....

In a major consolidation within the global logistics sector, CMA CGM Group has signed a definitive agreement to acquire FedEx Supply Chain, a subsidiary of FedEx Corp., at...
The international airline association BARIG (Board of Airline Representatives in Germany) is further expanding its focus on air freight and welcomes Maersk Air Cargo as a...
The cargo airline subsidiary of Mediterranean Shipping Co., the largest ocean container line in the world, on Monday ordered five next-generation 777-8 freighter aircraft...
United Airlines’ cargo revenue increased 22.6% to $527 million in the second quarter as the carrier benefited from a sharp rise in air cargo rates related to disruptions from...
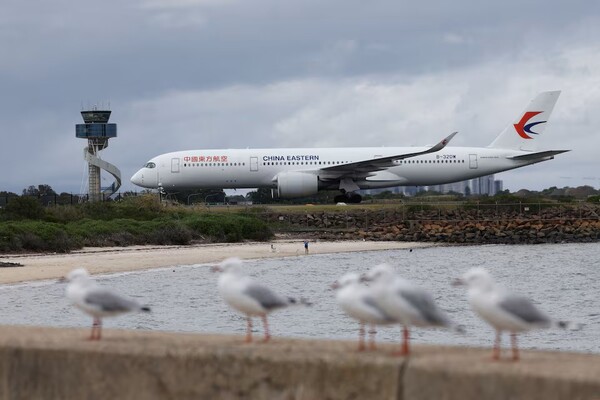
China's biggest airlines enter the peak summer travel season facing a more challenging outlook after warning of heavy first-half losses, with weakening demand raising doubts...
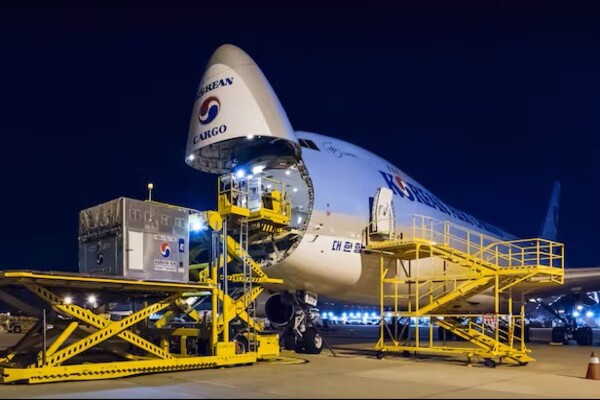
Semiconductor-driven exports keep Korea's cargo jets profitable as LCCs scramble to add freighters despite costly fuel

The thrice-weekly Bangkok-Cincinnati service connects manufacturing regions in Southeast Asia to U.S. hubs.

Airfreight rates are expected to rise 5% to 15% this year rather than fall, while air cargo demand expectations have also shifted upwards to the impact of the Middle East...
