


Worldwide air cargo demand rose by a further +3% in the final week of January, despite another volatile week of capacity disruptions, with tonnages boosted by flower shipments from Central & South America (CSA) and East Africa ahead of Valentine’s Day on 14 February.
According to the latest weekly figures and analysis from WorldACD Market Data, global chargeable weight in week 5 (26 January to 1 February) recorded a fourth consecutive week-on-week (WoW) increase after the annual year-end slump, thanks largely to a +21% WoW surge in tonnages from CSA, and a +11% WoW boost from Africa origins. However, taking into account that Lunar New Year (LNY) starts more than two weeks later this year compared with 2025, there was no evidence of any significant spike in volumes this year ahead of LNY on 17 February. LNY often triggers a brief surge in traffic from Asia Pacific origins prior to the mass factory closures in China and various other East and Southeast Asian territories in the weeks surrounding LNY.
Instead, tonnages from Asia Pacific origins as a whole were stable, WoW, in week 5 this year. There were WoW increases in traffic from Vietnam (+9%) and Taiwan (+12%) to the US, and volumes from China to the US edged up +1%, but from most other Asia Pacific origin countries, tonnages to the US dropped, WoW, leading to a -1% dip in traffic to the US for the region as a whole. Volumes to and from the US may have been impacted to some extent by further weather-related flight cancellations due to the winter storm, which had continued into week 5. Meanwhile, spot rates from Asia Pacific origins to the US rose by a further +5%, WoW, thanks to increases from most of the region’s main origin markets.
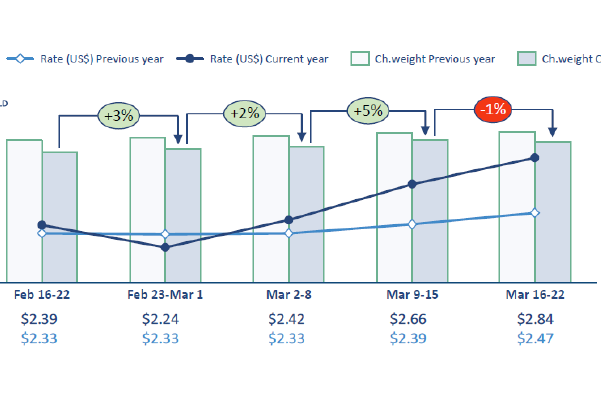
The picture from Asia Pacific origins to Europe in week 5 was similar, including a -1% dip in traffic for the market as a whole. There were significant WoW increases in traffic from Taiwan (+12%) and South Korea (+7%), as volumes continued to rebound from steep year-end falls, and modest rises from Malaysia (+5%) and Thailand (+2%); but China and most other origin markets recorded small to moderate WoW falls in cargo volumes to Europe in week 5. However, spot rates from Asia Pacific origins to Europe did continue to rebound, by a further +3%, WoW, including a +6% WoW rise from China and small to moderate increases from most of the region’s other main origin markets.
More broadly on the pricing side, average worldwide full-market rates in week 5 of US$2.42 per kilo were around +1% higher, WoW, and -2% below their level in week 5 last year, based on a mix of spot and contract rates. Meanwhile, average global spot rates in week 5 of US$2.68 per kilo were up +2%, WoW, and broadly the same as in week 5 last year.
Distorted comparisons with last year
Volume comparisons with last year, particularly for Asia Pacific origins, are heavily distorted by the earlier timing of LNY in 2025 – which fell on 29 January, and therefore tonnages from Asia Pacific origins had already dropped significantly by week 5 last year. As a result, chargeable weight from Asia Pacific origins in week 5 this year was up by +50%, year on year (YoY), with global tonnages up +22%, YoY, based on the more than 500,000 weekly transactions covered by WorldACD’s data.
That distorted comparison against last January’s figures due to the different timings of LNY is also true for full-month YoY tonnage comparisons, albeit to a more-limited extent. Preliminary full-month tonnage figures for January show a +9% YoY rise compared with last year, with volumes -6% below their levels in December.
Full-month average worldwide spot rates in January 2026 of $2.65 per kilo were -8% lower compared with December, and were down -1%, year on year.
Asia Pacific 2025 full-year analysis
Fresh analysis this week by WorldACD of various Asia Pacific markets to the US and to Europe highlights some interesting market trends taking place in the last 12 months. For example, combined full-year 2025 tonnages from mainland China (CN) and Hong Kong (HK) to the US dropped -7% in 2025, whereas to Europe they were up by +9%, year on year.
Within those figures, tonnages from Hong Kong to the US were down -13%, YoY, whereas volumes from mainland China to the US were down just -4%. To Europe, volumes from Hong Kong were up by +13%, YoY, whereas from mainland China they grew by a more modest but still strong +7%.
Those patterns have broadly continued into January, with full-month combined CN/HK tonnages to the US down -10%, YoY, whereas to Europe they were up +18%, YoY – thanks to a +26% YoY increase from Hong Kong and a +14% rise from China, although those figures are distorted somewhat by the relative timings of LNY.
However, some of the figures from Southeast Asia to the US and to Europe are even more striking. For example, full-year 2025 tonnages from Southeast Asia origins to the US grew by +29% in 2025, whereas to Europe they fell by -4%.
Source: WorldACD
Global air cargo rates have continued to rise strongly as stakeholders adjust to the dynamic and highly challenging conditions following the military attacks on Iran by the...
Driven by the direct impact of Jet A-1 fuel prices hitting a record high of nearly $200/barrel (a sharp spike from $95 at the beginning of the year), over 60% of international...
Vietnamese airlines are reviewing flight operations and preparing fuel surcharge plans in response to soaring aviation fuel prices linked to supply disruptions in the Middle...

Air charter rates have surged to “Covid-era” levels as the Iran conflict triggers a sharp capacity squeeze and volatile fuel costs, with brokers warning the market is being...

Many US logistics firms have their hands full with traffic triggered by the AI boom, with repercussions going well beyond data centre construction and outfitting to the energy...
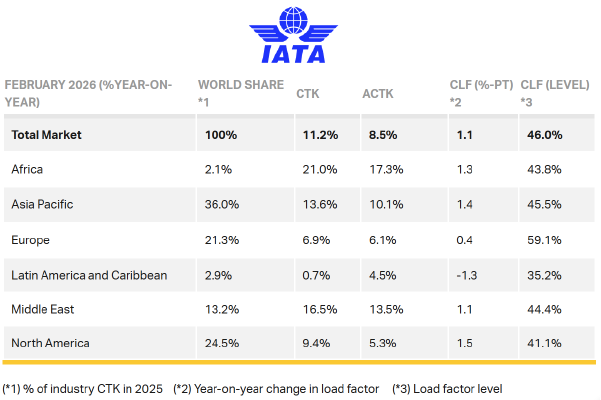
Total demand, measured in cargo tonne-kilometers (CTK), rose by 11.2% compared to February 2025 levels (+11.6% for international operations).

Beyond the immediate impact, the conflict in Iran highlights the need for resilient supply chains capable of quickly adapting to an increasingly uncertain global environment.
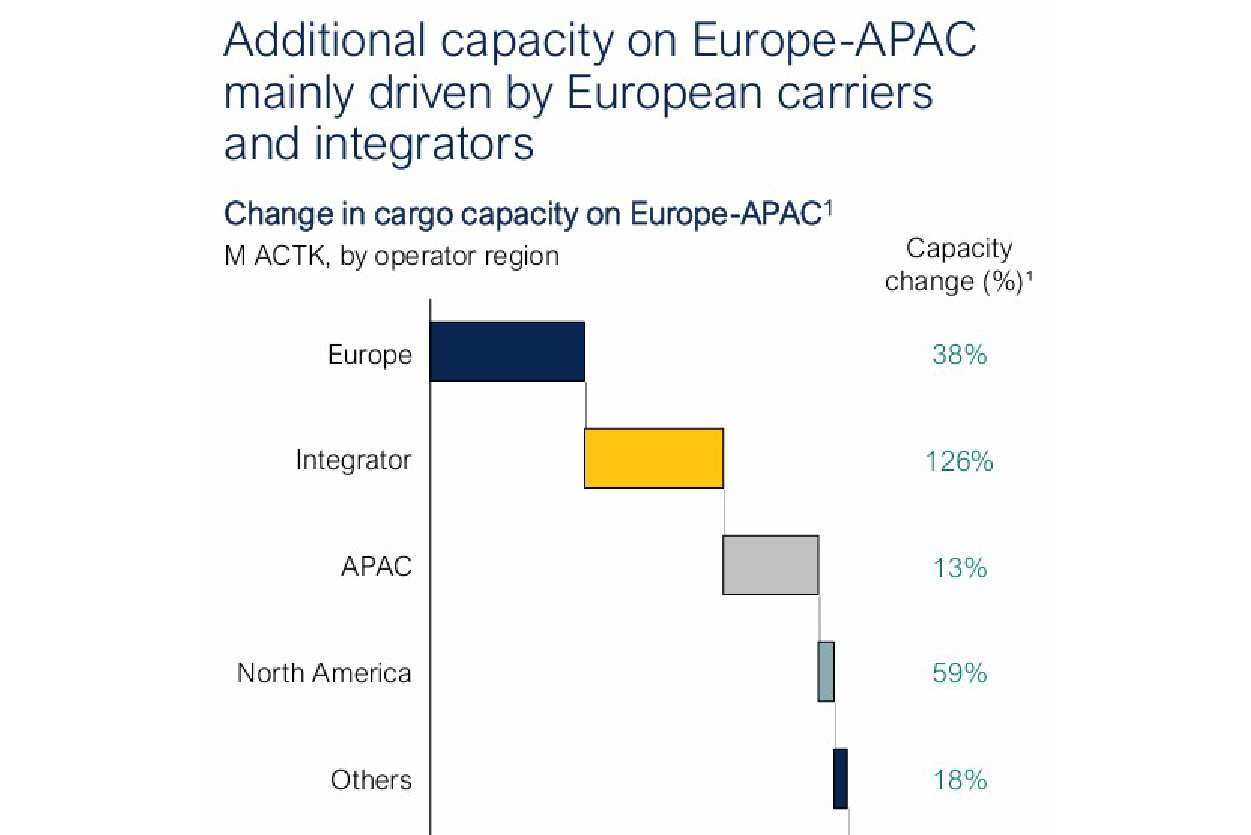
European Airlines and integrators have been the most active in adding capacity to the Asia-Europe trade lane to make up for the shortfall created by the loss of operations...
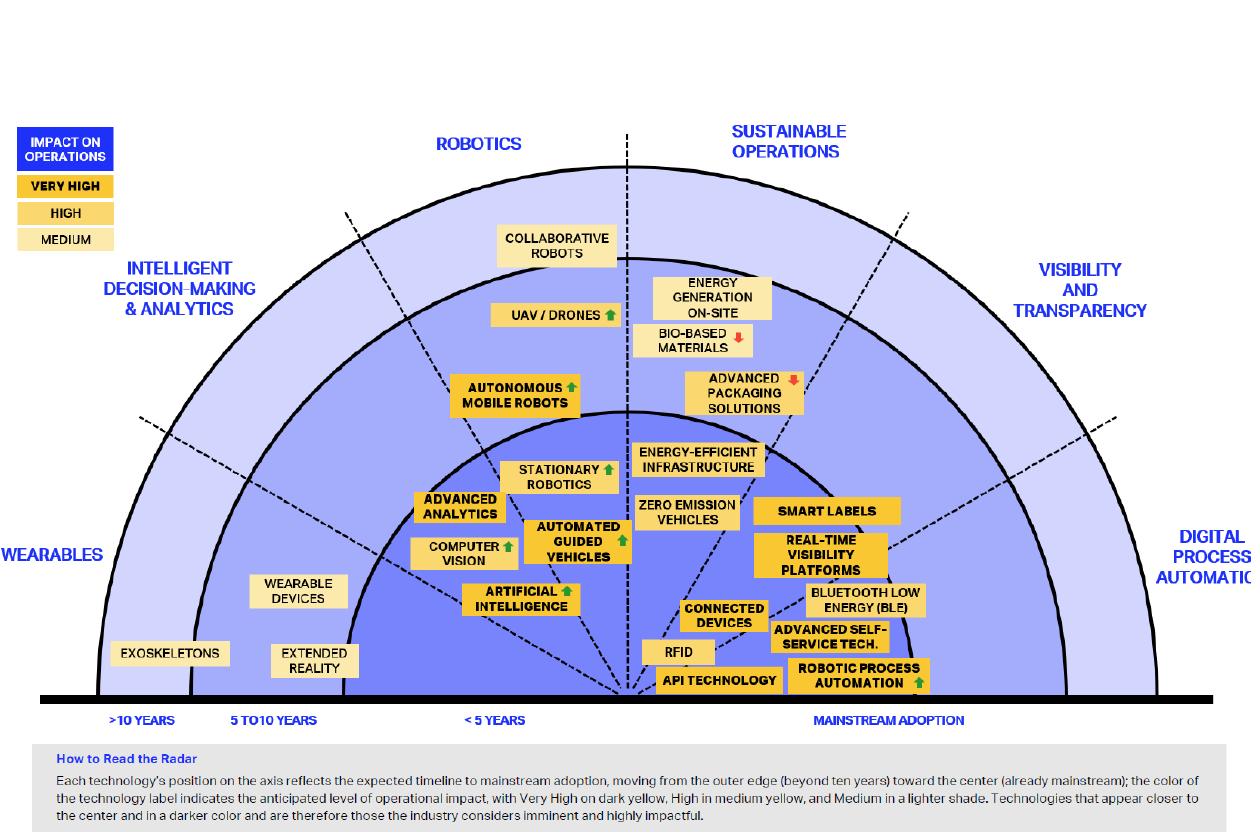
The global air cargo sector is undergoing a steady shift towards automation and data-driven operations, the International Air Transport Association (IATA) said in its 2026...

United Parcel Service Inc (UPS) opened a new US$100 million logistics center in Taiwan yesterday, its largest in the Asia Pacific, riding a wave of demand from tech companies.
